Saturday, February 20, 2016

Unit 3: Aggregate Demand Curve, Aggregate Supply Curve

Aggregate Demand Curve:


AD = Consumption Expenditures + Gross Private Domestic Investment + Government spending + Net Export 
      = (C+Ig+G+Xn)

Aggregate Demand is the demand by consumers, business, government & foreign. 


What definitely doesn't shift the curve? 

changes in price level cause a move along the curve.

Why is AD downward sloping? 

1. Real-Balance Effect 
    - higher price levels reduce the purchasing power of money, which decreases the quantity of expenditures
    - lower price levels increase purchasing purchasing power and increases expenditures.

ex: If the balance in your bank was $50,000, but inflation erodes your purchasing power, you will likely reduce your spending.

2. Interest-Rate Effect
    - when the price level increases, leaders need to change higher interest rates to get a REAL return to their loans. 
    - Higher interest rates discourage consumer spending and the business investment. 

3. Foreign Trade Effect
    - When U.S. price level rises, foreign buyers purchase fewer U.S. goods and Americans buy more foreign goods.
    - Exports fall and imports rises causing real GDP demand to fall (Xn decreases )

ex: If the price triple in the U.S., Canada will no longer buy U.S. goods causing quantity demanded of U.S. products to fall. 

What are the shifters of aggregate demand?  

1) A change in C, Ig, G, Xn
2) a multiple effect that produces a greater change than the original change in the four components
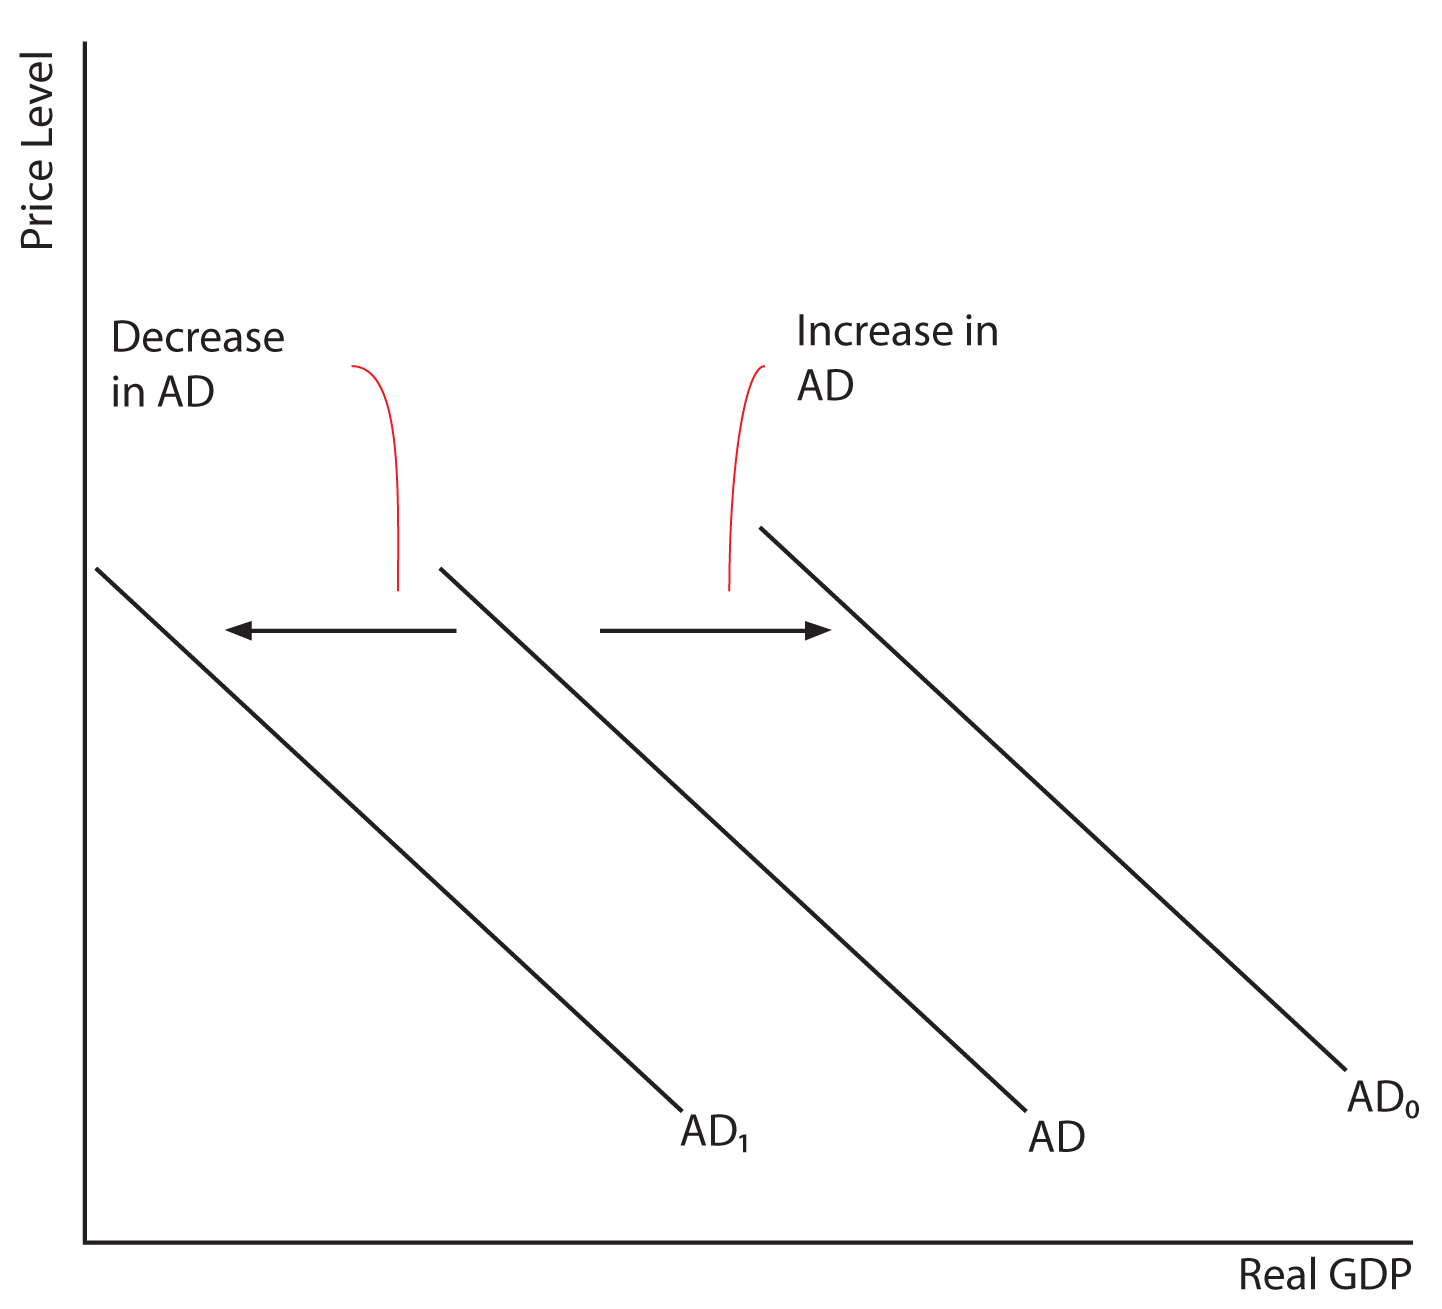

Increase in AD = AD --> 
Decrease in AD = AD <--


Determinants of Aggregate Demand:

1) Consumption 
      Household spending is affected by :
       • Consumer wealth 
          - More wealth = more spending (AD shift --> )
          - Less wealth = less spending (AD shift <-- )
       • Consumer expectation
          - positive expectations = more spending (AD shift --> )
          - negative expectations = less spending (AD shift <-- )
       • Household indebtedness
          - less debt = more spending (AD shift -->)
          - more debt = less spending (AD shift <--)
2) Gross Private Investment
      Investment spending is sensitive to : 
      • Real Interest Rate 
        - lower real interest rate = more investment (AD shift -->)
        - higher real interest rate = less investment (AD shift <--)
      • Expected Returns
        - higher expected returns = more investment 
        - lower expected returns = less investment (AD shift <--)
        - expected returns is influenced by : 
           ○ expectations in the future profitability 
             technology
             degree of excess capacity ( existing stocks of capital )
             business
3) Gov. spending 
      • more gov. spending (AD shift -->)
      •less gov. spending (AD shift <--)
4) Net Exports 
     sensitive to:
      • Exchange rates (international value of $)
        - strong $ = more imports & fewer exports (AD shift -->)
        - weak $ = fewer imports & more exports (AD shift <--)
      • Relative income
        - strong foreign economies = more export (AD shift -->)
        - weak foreign economies = less export (AD shift <--)


Aggregate Supply:

What are the difference between Long Run and Short Run?

Long Run:   
   • period of time where input prices are completely flexible and adjust to changes in the price level
   • level of Real GDP supplied is independent of the price level
Short Run:
   • period of time where input prices are sticky and do no adjust to change in the price level
   • the level of Real GDP supplied directly related to the price level

Long-Run Aggregate Supply (LRAS) 

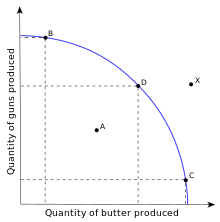
- marks the level of full employment in the economy (analogous to PPC)
- because input prices are completely flexible in long run, change in price level do not change firms real profits and therefore do not change firms level of output. (This means LRAS is vertical at the economy's level of full employment)

Change in SRAS

  • An increase in the SRAS is seen as a shift to the right (SRAS -->)
  • A decrease is seen as shift to the left (SRAS <--)
Key to understanding the shifts is per unit cost of production

Total Input Cost
___________________

Total Output

Determinant of SRAS (all affect unit production cost) 

1) Input Prices
    • Domestic Resource Prices:
       - Wage (75% of all business cost)
       - Cost of capital
       - Raw material (commodity prices)
    • Foreign Resource Prices
       - strong $ = lower foreign resource
       - weak $ = higher foreign resource
    • Market Power 

Increase in Resource Prices = SRAS <--
Decrease in Resource Prices = SRAS -->

2) Productivity
     Productivity = Total Output / Total Input

More productivity = lower unit production cost = SRAS -->
Lower Productivity = higher unit production cost = SRAS <--

3) Legal-Institution Environment 
     • Taxes & Subsides:
       - Taxes ($ to government) on business increase per unit production cost = SRAS <--
       - Subsides ($ from government) to business reduce per unit production cost = SRAS -->


Full employment, Recessionary Gap, Inflationary Gap

Full Employment :
    - full employment equilibrium exists where AD intersect SRAS and LRAS at some point
Recessionary Gap:
- exists when equilibrium occurs bellow full employment output
Inflationary Gap: 
   - exists when equilibrium occurs beyond full employment output

SRAS (Short Run Aggregate Supply) 

Nominal wages - the amount of money receive by worker per unit of time
Real Wages - The amount of goods and services a worker can purchase with their nominal wages.
Sticky wages - Where nominal wage level is set according to an initial price level and it does not vary due to labor contracts or other restriction


Sunday, January 31, 2016

Unit 2: Circular Flow, GDP, Real GDP, and Nominal GDP

Real GDP:

What is Peak?

- the highness point of GDP
- has the lowest unemployment & greatest spending

What is Expansion

- " Recovery Phase"
- where real GDP is increasing, which cost spending to increase and unemployment to decrease

What is Contraction/ Recession

- where real GDP declines for six months
- increase in unemployment and reduction in spending

What is Trough?

- the lowest point of real GDP
- it has the highest point of unemployment and highest amount of spending 

Circular Flow:


Gross Domestic Program (GDP)


What is a Circular Flow Diagram

- it represents the transaction in a economy

What is a Product Market?

- it is a place where goods and services are produced by business

What is a Factor Market?

- a place where households sell resources and business by resources

What is a Firm

 - an organization that produces goods and sales

What is a Household?

 - a person or a group of people that shares an income

What is GDP

- gross domestic program
- its the total market value of all final goods and services produced in a within country's border in a given year

What is GNP?

- gross national product
- the total market value of all final goods and services by citizens of that country on its land or foreign land


Gross = Total


Included in GDP:

C - personal consumption expenditures
IG - Gross private domestic investment
  1. Factory
  2. Factory equipment
  3. Construction of Houses
  4. Unsold inventory of products built in a year
G- government spending (can buy anything & everything)
Xn - Net Export (Exports - Imports)

C + IG + D + Xn ( Ex - Im)


Not Included in GDP:

1. Intermediate goods - good that requires further processing before it is ready for final use 

(ex. car parts)

2. Used of secondhand goods
     - trying to avoid double counting

3. Purely Financial Transactions 
(ex. stocks & bonds)

4. Illegal Activities 
(ex. drugs)

5. Unreported business activity 
(ex. unreported tips)

6. Non-market Activity  
(ex. volunteering, babysitting, or any work performed for yourself)

7. Transfer Payment 
- public (social security, welfare)
- private (scholarships -money transferred from donor to you)


What is Nominal GDP

- It's the value of the output produced in current prices
- can increase from year to year if either output or price increases.
- If we want to measure price increases known as inflation, we use nominal GDP.

What is Real GDP?

- It's the value of output produced in constant based year price.
-can increase from year to year only if output increases.
- If we want to measure economic growth, we use real GDP.
- injected for inflation
- base does not move


What is GDP Deflator?

- It is a price index use to adjust from nominal to real GDP.
  ( N / R x 100)
- if the base year, GDP Deflator with always = to 100
- In years after the base year, GDP is greater than 100
- In the particular year, GDP is less than 100


What is Consumer Price Index

- It is the most commonly use of inflation

What is Inflation Rate?


GDP Formulas

Nominal: Price x Quantity
Real: New Quantity x Base Price
Deflator: (Nominal / Real) x 100
Inflation: ((New Deflator - Old Deflator) / Old Deflator) x 100
Unemployment Rate: # of Unemployment / (# of employed + Unemployed) x 100
Expenditure : C + Ig + G + Xn
Income: W + R + I + P + statistical adjustment

Budget: (Gov. purchase of goods & services) + (Gov. transfer payment) - (Gov. Tax&Fee collection)
     + deficit, - surplus
Trade: Export - Import
     - deficit, + surplus
National Income: 1. (Compensation of Employees) + (Rental Income) + (Interest Income) + (Corporate Income) + (Properties Income)
     2. (GDP) - (Indirect Business Taxes) - (Depreciation) - (Net Foreign)
Disposable Income: (Nat. Income) - (Personal Household Taxes) + (Gov. Transfer Payment)

Thursday, January 14, 2016

Unit 1: Supply & Demand

Chapter 3&4 - Supply and Demand

Elasticity of Demand 

   - a measure of how consumers react in a change of price

What is Elastic Demand?

- demand that is very sensitive to a change in price
- E > 1
- the product is not necessity and there are available substitute 

ex: Soda
      Steak
      Candy
      Fur Coats

What is Inelastic Demand? 

- demand that is not sensitive to a change in price
- E < 1
- there are few to no substitute product is necessity
- people will always buy

ex: Gas
      Salt
      Milk
      Insulin/Medicine

Price Elasticity of Demand (PED)

Step 1: Quantity
(New Quantity - Old Quantity) / Old Quantity

Step 2: Price
(New Price - Old Price / Old Price) 

Step 3: PED
Δ in quantity demanded / % Δ in price


Unit 1: Scarcity, Factors of Production & PPGs

Chapter 1-2: Scarcity, Factors of Production & Production Possibilities Graphs

What is Macroeconomics?

   - the study of economy as a whole 
   - the BIG picture
   - "Can't see the forest because of trees"

Ex: Supply & Demand
      International Trade
      Minimum Wage


What is Microeconomics

  - study of individual or specific unit of the      economy

Ex: Market Structure
       Business Organization


What is Positive Economics

- it attempts to describe the world as is.
- very descriptive, collects and presents facts
- "What is" = facts

What is Normative Economics?

- it attempts to prescribe how the world should be
- very perspective
- "ought to be", "should be" = opinion based

What are Needs

- basic requirements for survival

ex: Food, Water, Shelter, Clothes

What are Wants

- Desire of citizens

What are Goods

- A tangible commodities (touch/feel)
-can be bought, sold, produce

ex: Capital Goods - items used in a creation of other goods. 
        ( trucks, factory, machine)
      Consumer Goods - goods that are introduced for final use of the consumer.

What are Services

- work that is performed for someone

ex: haircut, concert, going to school

What is Scarcity?

- the most fundamental economics problem facing all society
- how to satisfy unlimited wants with limited resources
- involves a choice

What are Shortage?

- where we have quantity demanded is greater than quality service

What are the Factors of Production?

  1. Land - natural resources
  2. Labor - work force, how much work is exerted
  3. Capital - physical capital tools, buildings, machines, trucks
  4. Entrepreneurship - innovative and risk taker  (owning your own business)
Capital.Entrepreneurship.Land.Labor !!!!

What causes the PPC/PPF to shift?

  1. Technological change
  2. Δ in resources
  3. Δ in labor force
  4. Economic growth
  5. Natural disaster/war
  6. More education on training

What is Trade-off?

-alternative that we give up whenever we choose one course of action over another

What is Opportunity Cost?

-the next big alternative

ex: travel, flight attendance

Production Possibilities Curve (PPC)

Production Possibilities Frontier (PPF)

Production Possibilities Graph (PPG)

-to show alternative ways to use an economic resources

Inside the Curve: Underutilization
                               Attainable
   (A)                       Inefficient
On the Curve:      Attainable
      (B,D,C)            Efficient
Outside the curve:Unattainable
       (x)                    Efficient


What are the Four Consumptions of PPG? 

  1. 2 resources (goods)
  2. Fixed resources (factors of production)
  3. Fixed technology
  4. Full employment of resources

What is Efficiency? 

- using the resources in such a way to maximize the production of goods and services

What is Allocative Efficiency?

- products being produced and the ones most by society

What is Productive Efficiency?

-products are being produced in the least costly way (any point on the PPC)

What is Underutilization?

- using fewer resources than an economy is capable of using